RE- Spatial-temporal and content analysis of Twitter Data
Replication of
Spatial, temporal and content analysis of Twitter data
Original study by Wang, Z., X. Ye, and M. H. Tsou. 2016. Spatial, temporal, and content analysis of Twitter for wildfire hazards. Natural Hazards 83 (1):523–540. DOI:10.1007/s11069-016-2329-6. and First replication study by Holler, J. 2021 (in preparation). Hurricane Dorian vs Sharpie Pen: an empirical test of social amplification of risk on social media.
Replication Author: Evan Killion
Replication Materials Available at: RP-Kang
Created: 06 May 2021
Revised: 26 May 2021
Abstract
Why study the spatial distribution of Twitter data?
Wang et al (2016) analyzed Twitter data for wildfires in California, finding that the social media activity lined up closely with wildfire events, both temporally and spatially, with clustering both around disruptions created by wildfires and in the hours and day after wildfire events - users are less likely to tweet at the exact moment of such events due to the time needed for information to disseminate and the fact that those disrupted by such events may need to take more pressing actions (e.g. evacuation) before tweeting. Additionally, the study found that that certain “opinion leaders” play important roles in the social media coverage, with tweets from reporters and local governments being extensively retweeted by users.
Holler (2021) is studying Twitter data for Hurricane Dorian on the Atlantic coast, finding that in spite of tending news and social media content regarding a false narrative of risk, original Tweets still clustered significantly along the real hurricane track, and only along the hurricane track.
Reproducing and replicating spatial research of social media coverage of certain events - be they disasters, elections, or celebration - continues to be relevant because the use of social media and other “crowd-sourced” sources of high-resolution Volunteered Geographic Information (VGI) in geosciences represents a paradigm-shifting innovation in the field. Access to data and data resolution have always been issues in the geosciences, and the ever-increasing growth of such sources of data and increasing use of such data opens important doors for geoscientists towards incredibly fine-grained analyses of events, globalized or localized.
In this replication study, I will explore twitter coverage of the Cinco de Mayo holiday on the US East Coast, and will be paying close attention to how results compare to the distribution of Latinx - specifically Mexican-American - populations in the region.
Original Study Information
summarize Wang et al (2016) similar to the Holler (2021) summary below
Wang et al (2016)’s original study investigated the temporal and spatial distributions, content, and network “geography” of Twitter activity surrounding the May 2014 California wildfires, specifically the San Marcos and Bernardo wildfires. Wang et al (2016) collected these tweets using spatial and temporal buffers, limiting their search to a window from May 13-22, 2014 - coinciding with the first report of wildfires and the date of near total containment, and within a 40 mi radius of downtown San Diego - which encompassed most of San Diego County.
Wang et al used the tm package in R 3.1.2 to preprocess the collected tweets, removing “noise” like URLs from the tweets, and going on to text-mine tweet content to identify significant terms and clusters of terms within tweets, picking up on important terms like “update” and “evacuate”. This information allowed the authors to conclude that geographic awareness during such events was strong - locations like Carlsbad were tweeted about often - and that users were interested in information surrounding fire damage and responses.
Using the igraph package with the same data, Wang et al were able to map connections between users within the same network, with results supporting the authors’ idea of “opinion leaders”. They found that a few important “leaders” like a collection of local news networks and the San Diego County government forming a a collection of core nodes of retweets.
In their analysis of spatial relationships, the authors used a dual kernel density estimate to vizualize the relative prevalence of tweets within the study region, with this technique producing maps which showed a spatial distibution of tweets in the areas around fire locations, as well as certain population centers, like downtown San Diego.
Holler (2021) losely replicated the methods of Wang et al (2016) for the case of Hurricane Dorian’s landfall on the U.S. mainland during the 2019 Atlantic Hurricane season. Holler modified Wang et al’s methods by not searching for retweets for network analysis, focusing instead on original Tweet content with keywords hurricane, Dorian, or sharpiegate (a trending hashtag referring to the storm). Holler modified the methodology for normalizing tweet data by creating a normalized Tweet difference index and extended teh methodology to test for spatial cluserting with the local Getis-Ord statistic. The study tested a hypothesis that false narratives of hurricane risk promulgated at the highest levels of the United States government would significantly distort the geographic distribution of Twitter activity related to the hurricane and its impacts, finding that original Twitter data still clustered only in the affected areas of the Atlantic coast in spite of false narratives about risk of a westward track through Alabama. The replication study by Holler (2021) used R, including the rtweet, rehydratoR, igraph, sf, and spdep packages for analysis.
Materials and Procedure
In querying Twitter’s API, a simple query of “Cinco de Mayo” was found to be sufficient and produced a suitable mass of tweets for analysis, as well as a general query searching for all tweets within the study period, which was set as the period of April 29th through May 6th. An original query for April 28th through May 5th was also made, but was overwritten, requiring the analysis to be redone on May 6th with the data queried on that day.
A file containing status_id’s for the Cinco de Mayo query are available here, and the tweets queried for baseline twitter activity for the study period - for use in normalizing studied tweets - are available here.
The procedure used to conduct this analysis generally followed the workflows of both Wang et al and Holler, however a kernel density analysis was not used for this study, instead finding Getis-Ord G scores for the counties within the study region and then mapping those scores as relative “cold” and “hot” spots, with low and high relative densities of tweets relating to Cindo de Mayo. Additionally, network analysis was not conducted, following the methods used by Holler in his study of Hurrican Dorian. Code run in RStudio to conduct the analysis (with ‘_cinco’ appended to the end of the file name) is provided here.
Replication Results and Discussion
Temporal Analysis

As would be expected, Twitter activity shows a pronounced peak in tweets related to Cinco de Mayo, with little mention of the holiday before it occurs. Some gradual increase in tweet frequency does appear in this analysis, likely attributed to anxiously excited party goers, but the bulk of activity related to Cinco de Mayo occurs during the later part of May 5th through to the very beginning of May 6th. As it took place on a Wednesday this year (2021), many would-be celebrants were working either in-person or remotely, likely contributing to this later spike in activity which corresponds well to dinners and after-dinner parties. This largely follows the pattern identified by Wang et al, with Twitter activity closely corresponding to the event studied, though the lack of a hazard seems to have allowed users to tweet closer to events than in the wildfire events studied by Wang et al.
Content Analysis
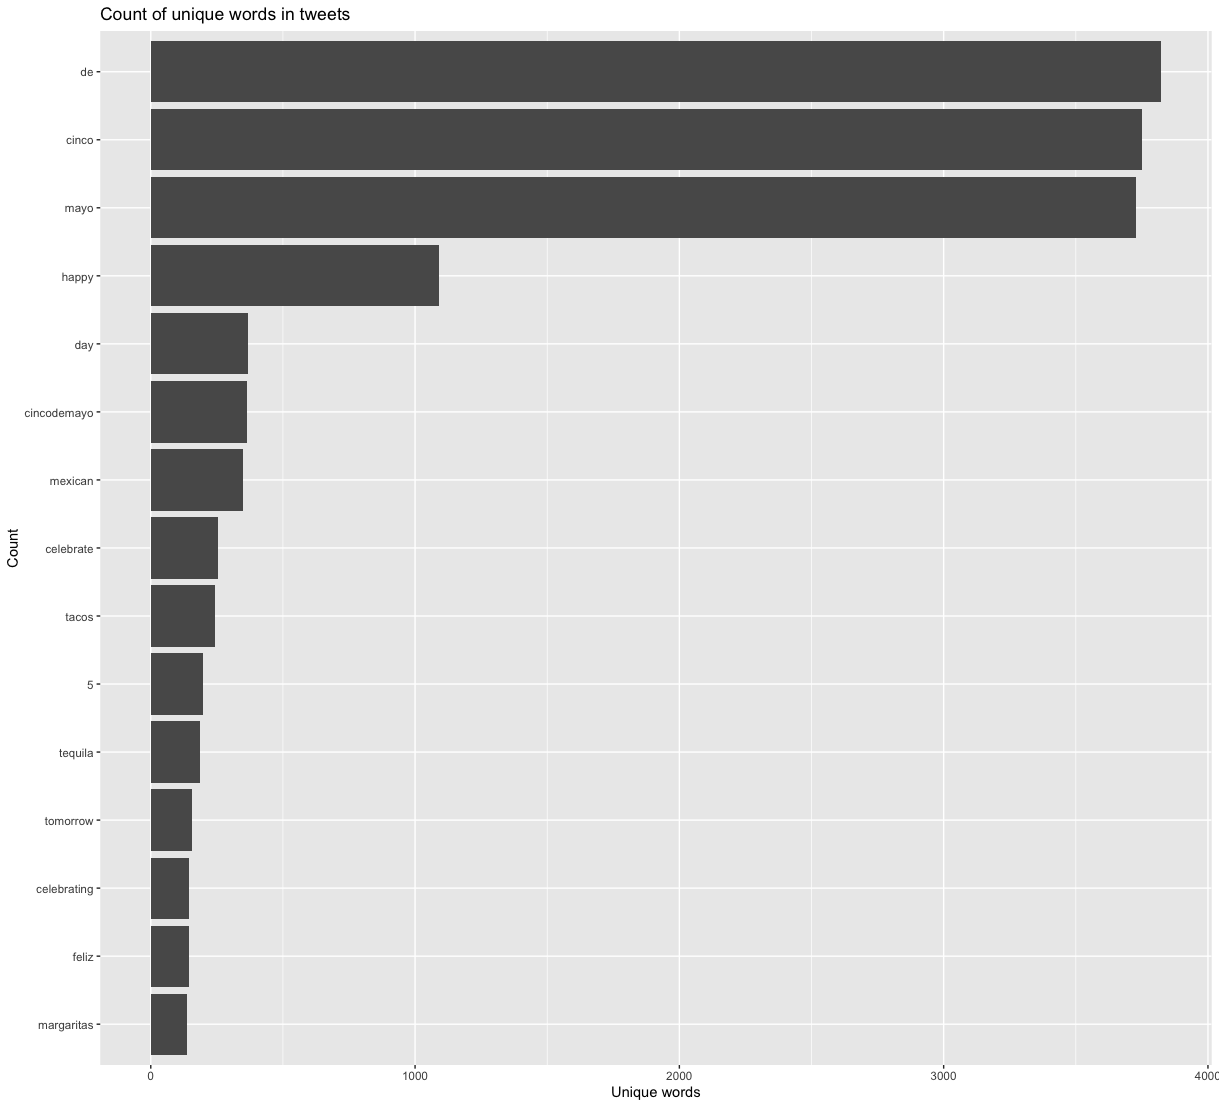
Unsurprisingly, content analyses of the collected tweets found that by far, “de”, “cinco”, and “mayo” were the most tweeted words. Interestingly, however, “cinco” and “de” pull out ahead of “mayo”, perhaps due to jokes like “Cinco de Drinko”. “Happy” and “feliz” show up in the top 15, likely attibuted to holiday well wishers, and Mexican food and drink items like “tacos”, “tequila”, and “margaritas” likewise end up in this list due to their prevalence in US Mexican cuisine.
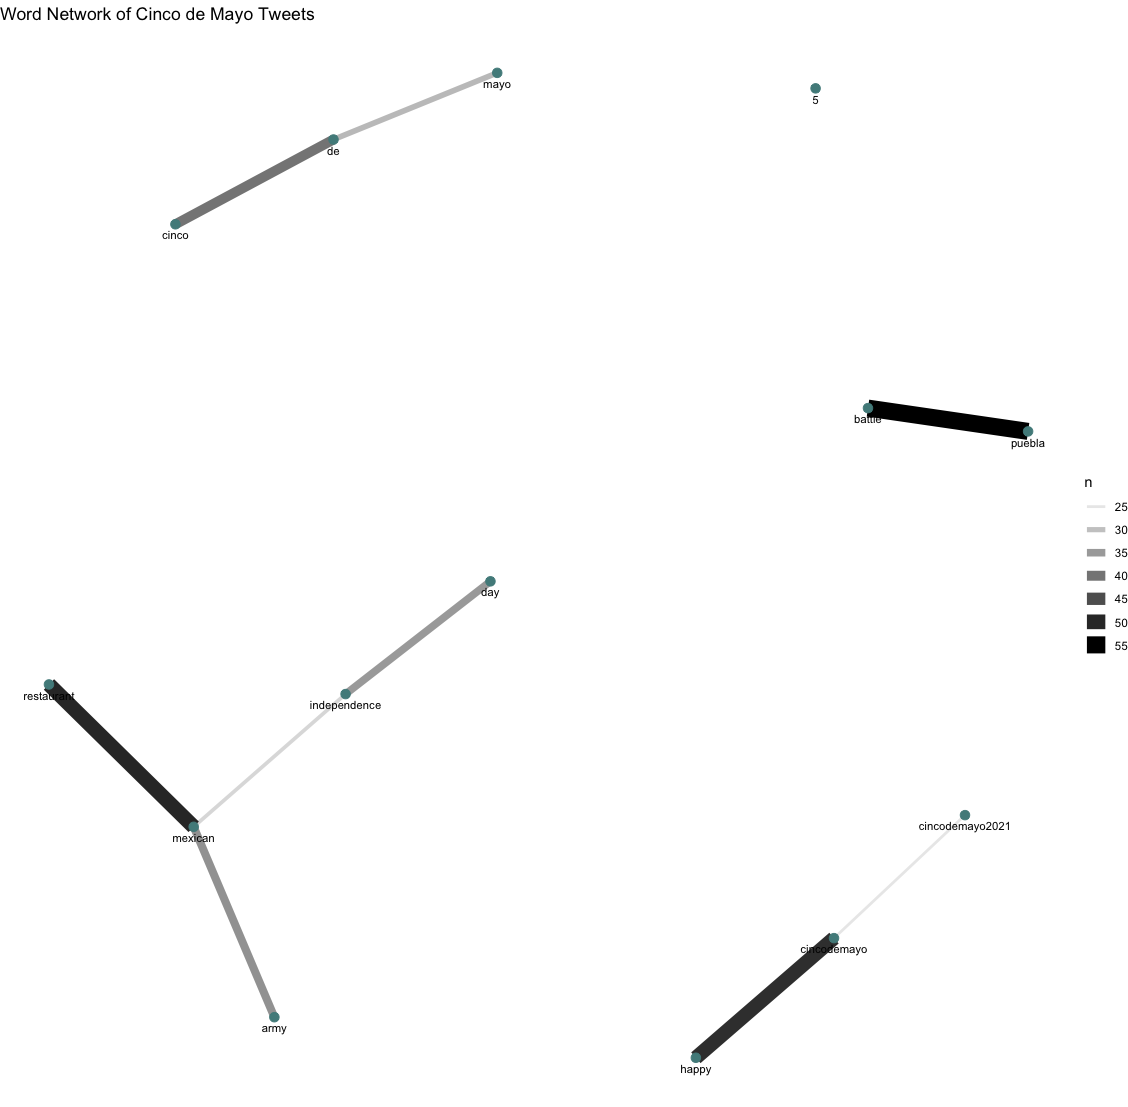
An additional analysis, this time of word pairings in tweets, backs up the idea that jokes like “Cinco de Drinko” are contributing to “mayo’s” somewhat lower prevalence in tweets. As seen above, “cinco” and “de” are tweeted together significantly more often the “de” and “mayo”. “Mexican” shows up often in conjunction with “army”, “restaurant”, and “independence” - a misconception, as it celebrates a victory over the French post-independence - as well as “battle” and “puebla”, connected to the actual battle that is actually commemorated on Cinco de Mayo.
Spatial Analysis
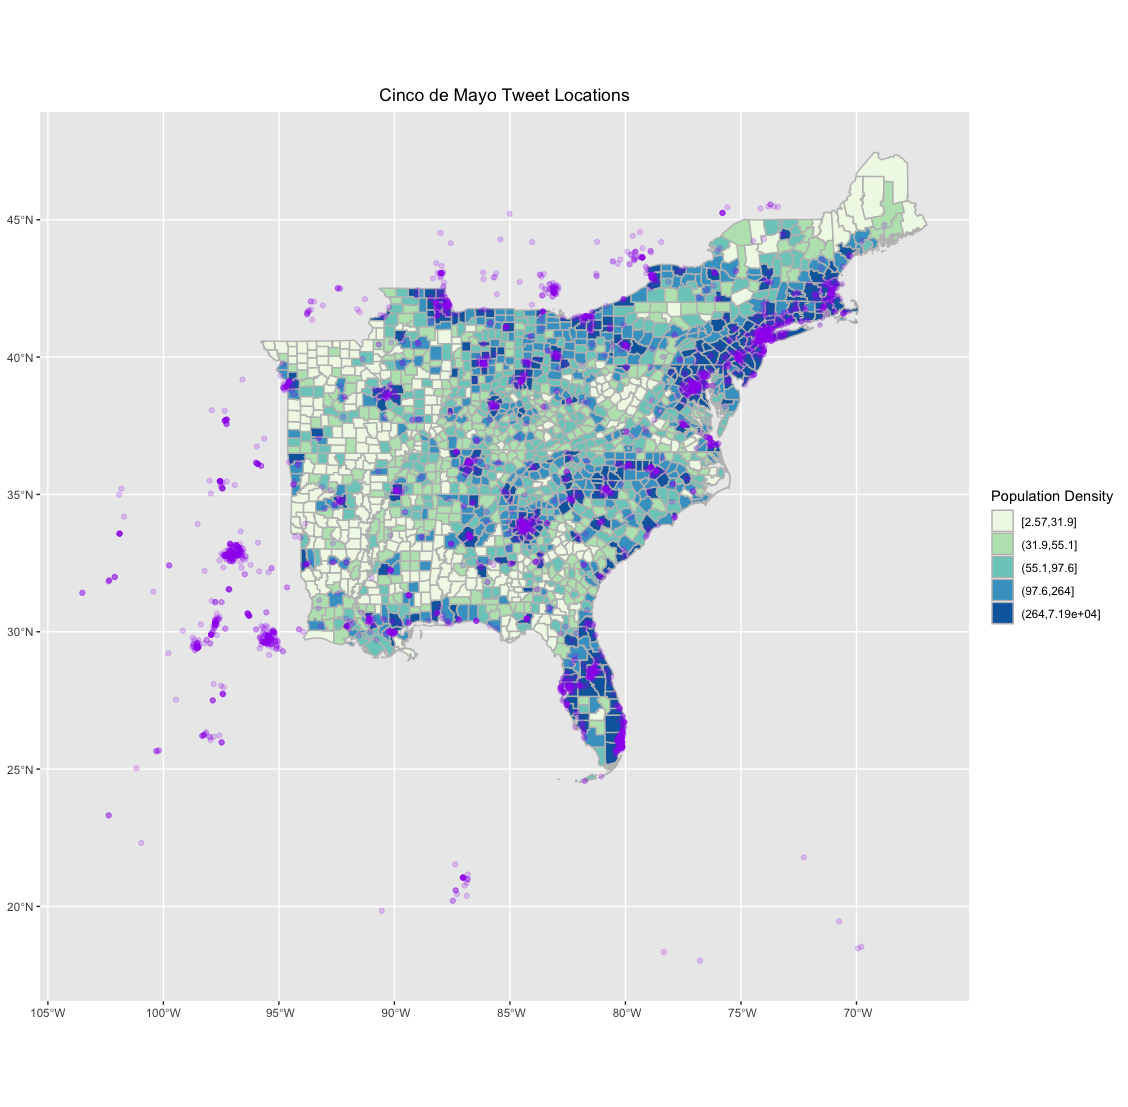
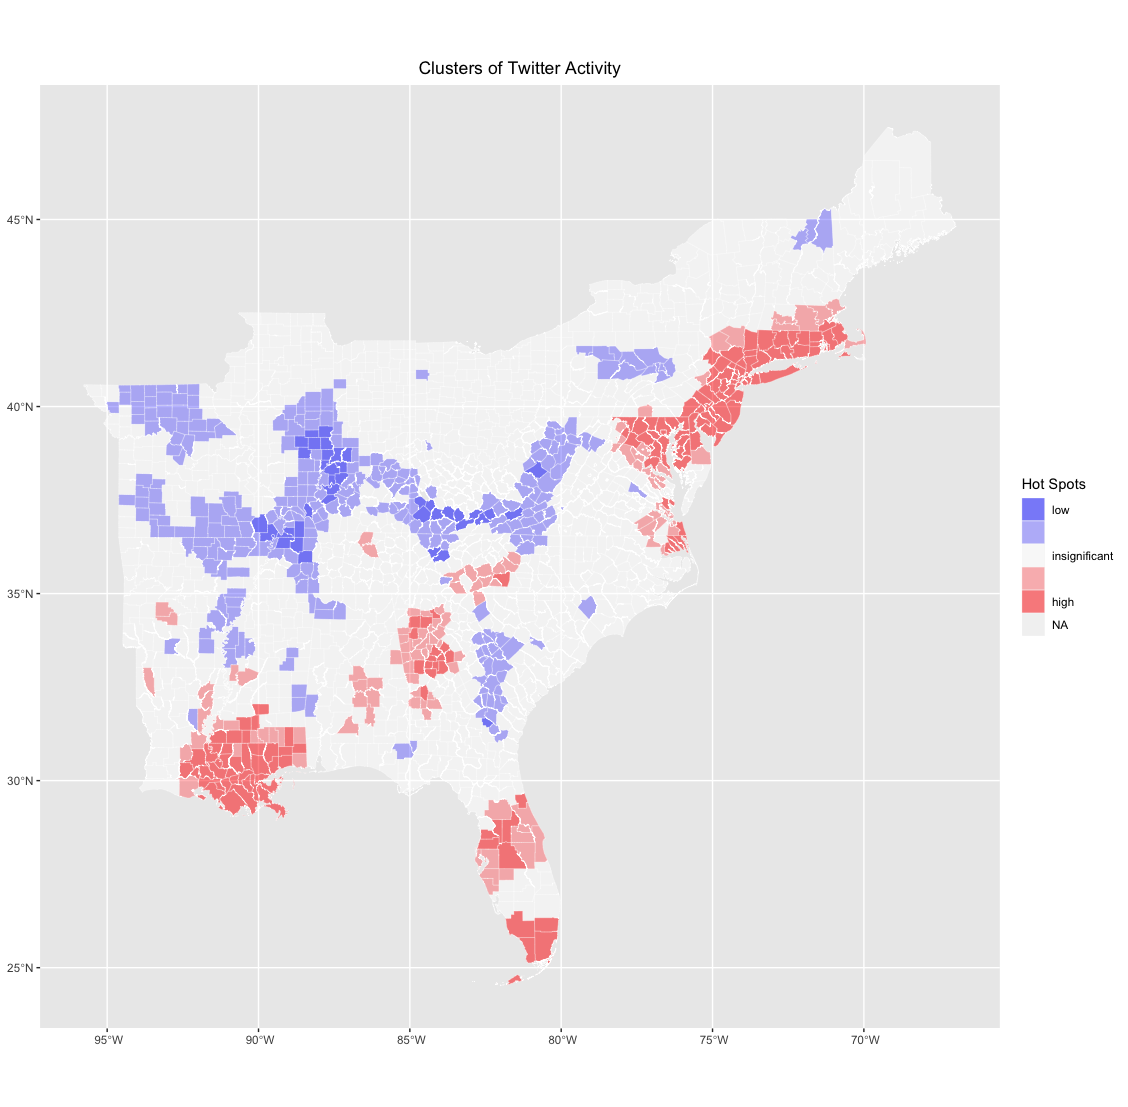
As expected, the first map shows that the distribution of tweets about Cinco de Mayo broadly map onto population density, with most tweets being in population centers throughout the study region. Looking more deeply, however, the second map of normalized “hotspots” of twitter activity shows some interesting patterns. Six primary “hotspots” appear in this map: metropolitan South Florida, Orlando, the urbanized Northeast, metro Atlanta, southern Louisiana, and the western parts of North Carolina. The first four are fairly immediately explainable; they’re all large metropolises, all with substantial Latino populations, as seen in the map below, from Social Explorer.
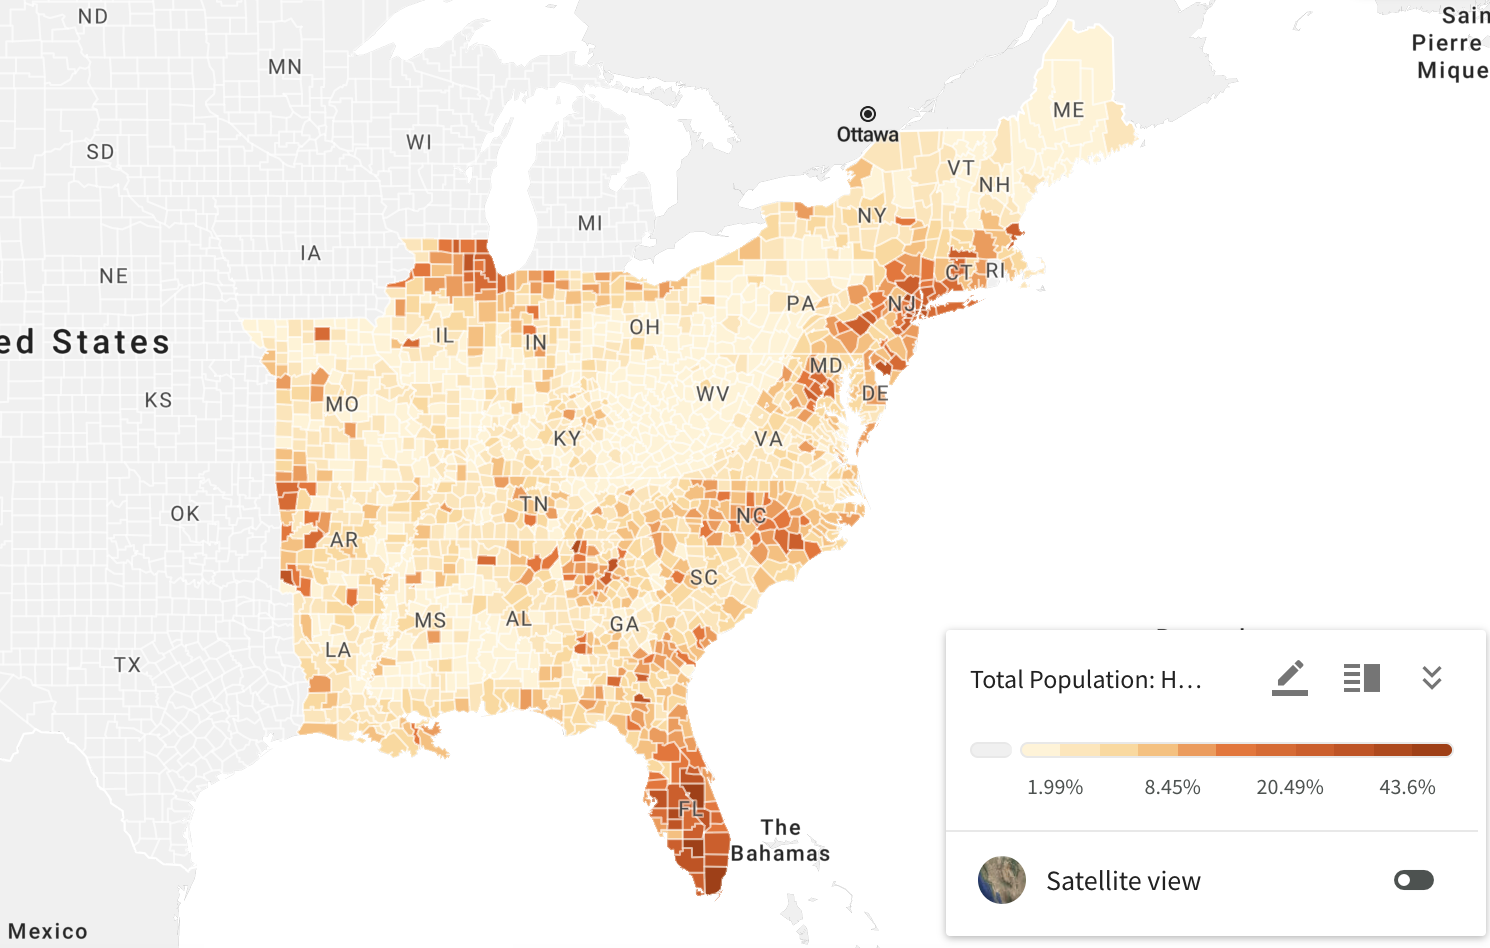 Note: this map was produced from American Community Survey data using Social Explorer
Southern Louisiana and North Carolina provide interesting cases, however, as neither has a particularly significant Latino population. North Carolina remains an enigma, especially due to the rural nature of many of the counties that show up as “hotspots” and the fairly low percentage of Latino residents, but southern Louisiana could in this case be potentially buoyed by New Orleans’s reputation as a party center, though their fairly wide reach of this “hotspot” remains intriguing.
Unsurprisingly, “cold” spots largely consisted of parts of Appalachia and the rural midwest, places without a critical mass of Latino residents or party- and club-goers.
With the exception of the two final examples of hotspots, the patterns detected in this analysis largely follow the expectations set up by Wang et al and Holler, with hotspots largely concentrated in areas where the events studied may be a bit more prevalent.
Unplanned Deviations from the Protocol
Due to the nature of the Twitter API and their use of a radius, paired with the county-based information found via the US Census Bureau’s API, the queries did not exactly line up, and some tweets ended up outside the study area, particularly on the western edge of the region. Thus, not all tweets ended up being joined to counties and studied in the spatial analysis.
Additionally, a network analysis is not included here. An analysis was performed in R, but the graphic was rendered in a nearly unusable state, and was not included here.
Otherwise, this study barely diverged from the procedure provided by Holler, again available here.
Conclusion
This study, investigating Twitter activity surrounding Cinco de Mayo, found broadly the same patterns as those found by Wang et al and Holler, namely that:
- temporal patterns of activity were closely tied to events, largely occurring within the 24hrs following a hazardous event; this study found minimal lag in activity, likely due to lack of hazards.
- spatial patterns tended to coincide with areas effected by events, with many metropolitan areas with significant Latino populations ranking as “hotspots” in this study
Additionally, content of users tweets largely lined up with activities for the holiday. The name of the holiday, separated or strung together in one “word” ranked highest, but Mexican foodstuffs like tacos, margaritas, and tequila - the foods of choice for celebrants at Mexican restaurants across the country - also found their way into the list of most used terms. While this doesn’t cleanly map on to Wang et al and Hollers findings, which found interest in responses to disasters in dissemination of information, the clear relevance of associated actions, whether dinner and drinks or evacuation, does carry throughout the three studies.
References
Holler, J. 2021. Hurricane Dorian vs Sharpie Pen: an empirical test of social amplification of risk on social media.
Wang, Z., X. Ye, and M. H. Tsou. 2016. Spatial, temporal, and content analysis of Twitter for wildfire hazards. Natural Hazards 83 (1):523–540. DOI:10.1007/s11069-016-2329-6.
Report Template References & License
This template was developed by Peter Kedron and Joseph Holler with funding support from HEGS-2049837. This template is an adaptation of the ReScience Article Template Developed by N.P Rougier, released under a GPL version 3 license and available here: https://github.com/ReScience/template. Copyright © Nicolas Rougier and coauthors. It also draws inspiration from the pre-registration protocol of the Open Science Framework and the replication studies of Camerer et al. (2016, 2018). See https://osf.io/pfdyw/ and https://osf.io/bzm54/
Camerer, C. F., A. Dreber, E. Forsell, T.-H. Ho, J. Huber, M. Johannesson, M. Kirchler, J. Almenberg, A. Altmejd, T. Chan, E. Heikensten, F. Holzmeister, T. Imai, S. Isaksson, G. Nave, T. Pfeiffer, M. Razen, and H. Wu. 2016. Evaluating replicability of laboratory experiments in economics. Science 351 (6280):1433–1436. https://www.sciencemag.org/lookup/doi/10.1126/science.aaf0918.
Camerer, C. F., A. Dreber, F. Holzmeister, T.-H. Ho, J. Huber, M. Johannesson, M. Kirchler, G. Nave, B. A. Nosek, T. Pfeiffer, A. Altmejd, N. Buttrick, T. Chan, Y. Chen, E. Forsell, A. Gampa, E. Heikensten, L. Hummer, T. Imai, S. Isaksson, D. Manfredi, J. Rose, E.-J. Wagenmakers, and H. Wu. 2018. Evaluating the replicability of social science experiments in Nature and Science between 2010 and 2015. Nature Human Behaviour 2 (9):637–644. http://www.nature.com/articles/s41562-018-0399-z.
 This work is licensed under a Creative Commons Attribution-NonCommercial-ShareAlike 4.0 International License.