RP- Vulnerability modeling for sub-Saharan Africa
Replication of
Vulnerability modeling for sub-Saharan Africa
Original study by Malcomb, D. W., E. A. Weaver, and A. R. Krakowka. 2014. Vulnerability modeling for sub-Saharan Africa: An operationalized approach in Malawi. Applied Geography 48:17–30. DOI:10.1016/j.apgeog.2014.01.004
Replication Authors: Evan Killion, Joseph Holler, Kufre Udoh, Open Source GIScience students of fall 2019 and Spring 2021
Replication Materials Available at: RP-Malcomb
Created: 24 April 2021
Revised: 26 May 2021
Abstract
The original study is a multi-criteria analysis of vulnerability to Climate Change in Malawi, and is one of the earliest sub-national geographic models of climate change vulnerability for an African country. The study aims to be replicable, and had 40 citations in Google Scholar as of April 8, 2021.
Original Study Information
The study region is the country of Malawi. The spatial support of input data includes DHS survey points, Traditional Authority boundaries, and raster grids of flood risk (0.833 degree resolution) and drought exposure (0.416 degree resolution).
The original study was published without data or code, but has detailed narrative description of the methodology. The methods used are feasible for undergraduate students to implement following completion of one introductory GIS course. The study states that its data is available for replication in 23 African countries.
Data Description and Variables
Briefly, the data used for this analysis and the original study came from three sources: USAID’s Demographic and Health Survey (DHS), the Famine Early Warning Network (FEWSNET), and the UN Environmental Program (UNEP). All data points were transformed in the original study and our replication to 1-5 scores using the formula (percentage rank) * 4 + 1, with the percentage rank descending or ascending based on data classifications - e.g. a high number of livestock could be given a positive score of 5, and a high number of sick family members given a negative score of 1. Additionally, a geopackage of traditional authorities - an administrative division in Malawi in between the village level and the high-level, low-resolution district level - was provided. The original authors chose this as the level of analysis due to their perception of it as the most useful level for analysis - districts were much to large, there being only 28 for the entire country, whereas villages were less equipped than traditional authorities or districts for later planning to mitigate climate change effects. Traditional authorities, there being more than 200, provided a useful middle ground, fine grained enough for meaningful analysis, but providing regional governing structures that might be equipped to implement interventions at a regional level.
The DHS was the largest source of data, providing household level information related to a number of health and socio-economic indicators, including number of children in households, numbers of various kinds of livestock, and access to electricity. This data broadly allowed for the quantifying of the adaptive capacity of households and traditional authorities. This data was broken up into two major sets, “Assets” and “Access.” Assets were those indicators, like number of livestock, which quantified the basic economic wellbeing of households, while Access was those indicators quantifying access to resources like electricity, water, etc. Within the Access set, the authors also included the sex of the head of each household, which may be used as a proxy for access to social capital and other similar resources.
The FEWSNET data provided a large set of statistics related to livelihood sensitivity. This was calculated at a fairly low resolution, with Malawi broken up into only 19 zones. These zones were created by FEWSNET based on areas that share common farming practices, labor patterns, and environmental coping strategies. While useful in creating a fuller picture of climate change vulnerability, the scale of this data is at a much higher level than other provided data, with both DHS and UNEP’s data at comparatively much finer resolutions; even the aggregated version of the DHS data created in this study was made up nominally of This data did need to be pre-processed for analysis, working - in collaboration with Maddie Tango, Steven Montilla, Jackson Mumper, Arielle Landau, and Sanjana Roy - to classify what figures were drawn upon to calculate the percentage of households’ food that came from their own farms, percent of income from wage labor, percentage of labor vulnerable to market shocks, and “ecological destruction associated with livelihood coping strategies,” and eventually to manually calculate all four of these figures for each livelihood zone.
Finally, UNEP’s data provided two rasters of 1) flood risk and 2) drought risk. No pre-processing needed to be done to this; it was used in its weighted quintile form - like with both the DHS and FEWSNET data - and added to rasterized versions of the corresponding weighted FEWSNET and DHS data (created during the course of analysis) to create the final vulnerability map. These rasters were at a fairly high resolution, but were limited in their extent, with some areas seemingly not receiving a score to be used later, there being minimal risk in these areas.
Analytical Specification
The original study was conducted using ArcGIS and STATA, but does not state which versions of these software were used. The replication study will use R.
Materials and Procedure
The first procedure below was created without accessing the data for this study first. The second was created after investigating the data and its sources.
Data
2004 - 2010 DHS w/ GPS Demographic and health survey (assets & access) UNEP/grid Europe (biophysical exposure) Famine early warning network (livelihood)
Discussion of Original Methods
Procedure 1
Step 1: Preprocessing of Geographic Boundaries
2004-2010 DHS data points (for each village surveyed): District → disaggregated → villages → disaggregated → traditional authorities
DHS Households table (1 row/house) → field calc → conversion to 0-5 scale → weighted A/C score → join by attribute w/ DHS data points (village level) → spatial join AND group w/ traditional authorities (GADM adm_2) → traditional authorities w/ Capacity Score → Raster
Livelihood zones → copy #s from spreadsheet →rescale 0-5 → Rasterize → Raster Calc (w/ Drought Exposure and Flood Risk)
Drought exposure → rescale 0-5
Flood risk → rescale 0-5
Step 2: Weighting
Data Input: UNEP/grid Europe, Famine early warning network → Raster → Weight values: All vulnerability measures were weighted (table 2) and normalized between 0 & 5 (RStudio)
Step 3: Creating the Model of Vulnerability
Calculate: Household resilience = adaptive capacity + livelihood sensitivity - biophysical exposure
Procedure 2
- Data Preprocessing:
- Download traditional authorities: MWI_adm2.shp
- Adding TA and LZ ids to DHS clusters
- Removing HH entries with invalid or unknown values
- Aggregating HH data to DHA clusters, and then joining to traditional authorities to get: ta_capacity_2010
- Removing index and livestock values that were NA
- Sum of Livestock by HH
- Scale adaptive capacity fields (from DHS data) on scale of 1 - 5 to match Malcomb et al.
- Weight capacity based on table 2 in Malcomb et al.
- Calculate capacity by summing all weighted capacity fields
- Summarize capacity from households to traditional authorities
- Joining mean capacities to TA polygon layer
- Making capacity score resemble Malcomb et al’s work (scores on range of 0-20) by multiplying capacity score by 20
- Categorizing capacities using natural jenks methods
- Creating blank raster and setting extent of Malawi - CRS: 4326
- Reproject, clip and resampling flood risk and drought exposure rasters to new extent and cell size
- Uses bilinear resampling for drought to average continuous population exposure values
- Uses nearest neighbor resampling for flood risk to preserve integer values
- Removing factors and recasting them as integers
- Clipping TAs with LZs to remove lake
- Rasterizing final TA capacity layer
- Masking flood and drought layers
- Reclassify drought raster into quantiles
- Add all RASTERs together to calculate final output: final = (40 - geo) * 0.40 + drought * 0.20 + flood * 0.20 + livelihood sensitivity * 20
- Using zonal statistics to aggregate raster to TA geometry for final calculation of vulnerability in each traditional authority
Replication Results
Adaptive Capacity
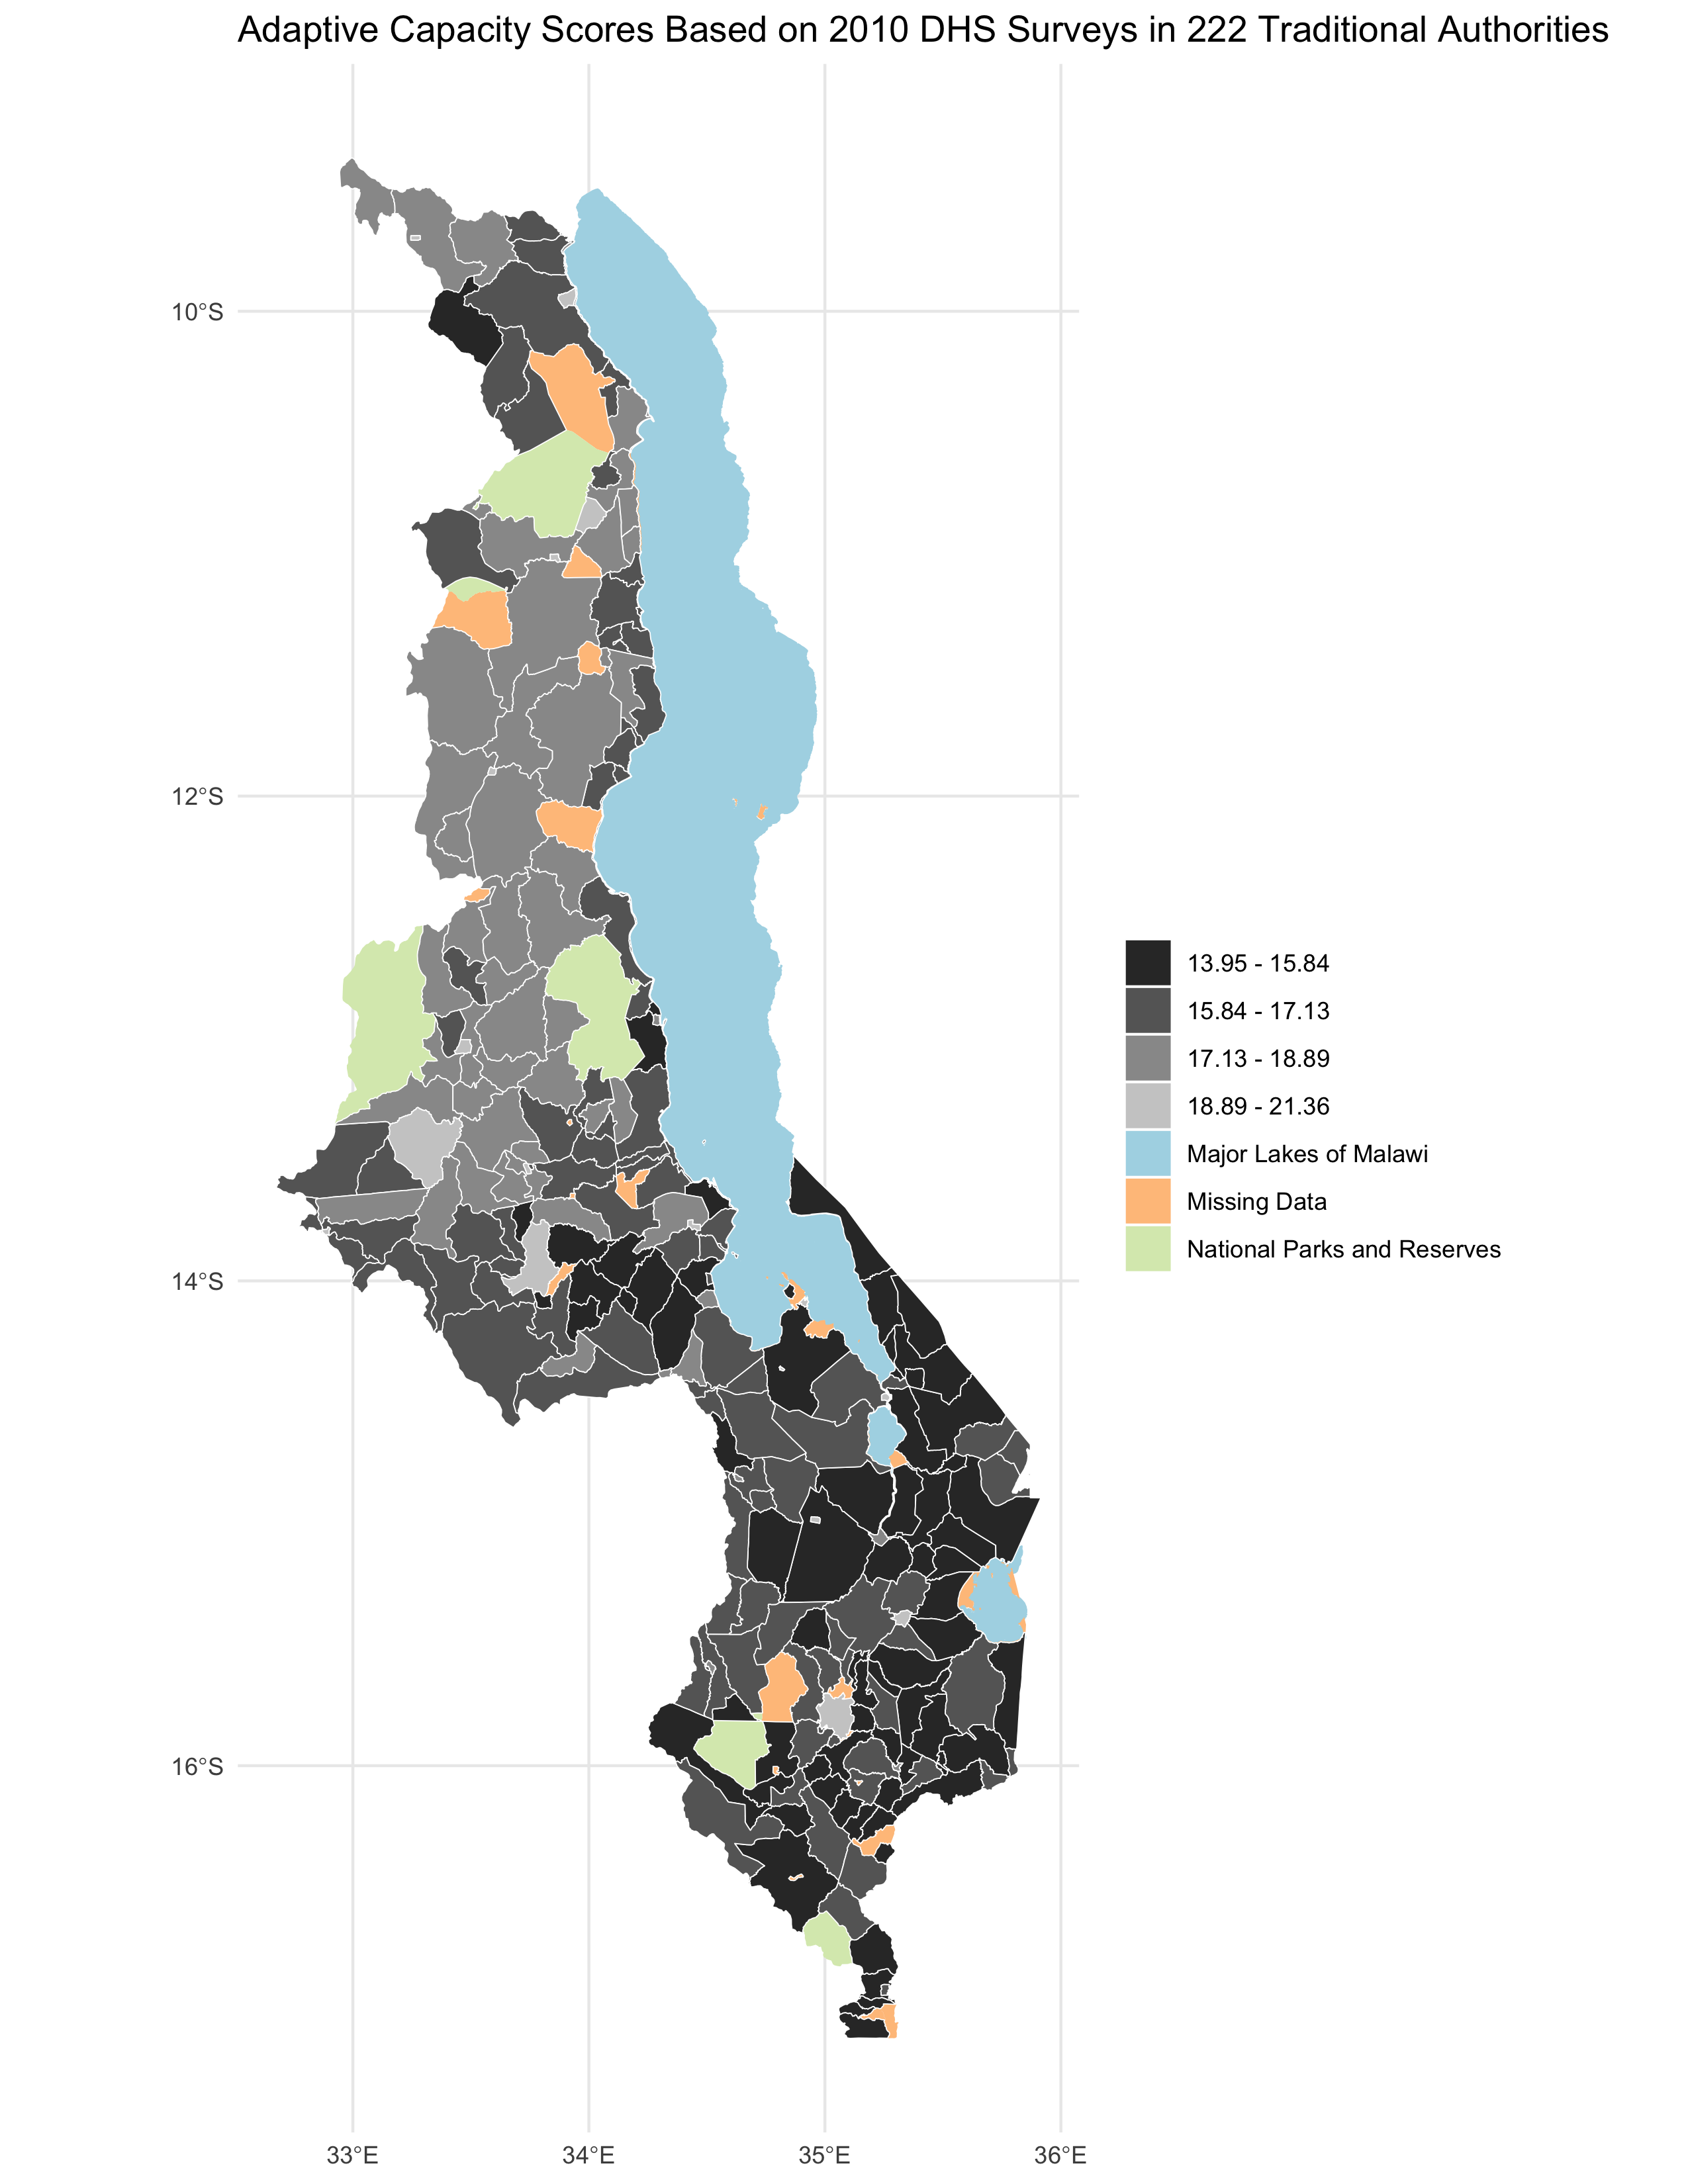
In reproducing this analysis, we created the above map showing adaptive capacity scores - a figure described above derived only from the DHS “Assets” and “Access” data. Looking at these results, a pattern becomes immediately apparent: the northern “half” of the country for the most part returns consistently higher adaptive capacity scores, with the southern part returning lower scores. In the north, however, an important exception to this trend exists: the shoreline of Lake Malawi, with darker coloring and lower scores. This largely follows the results found by Malcomb et. al. Reasons why this pattern appears are unclear, but the presence of more cities in the south, and thus more arable land per-capita in the north could be a contributing factor.
While general trends did hold, when comparing scores given in the reproduction and analysis, values consistently do not hold up well.
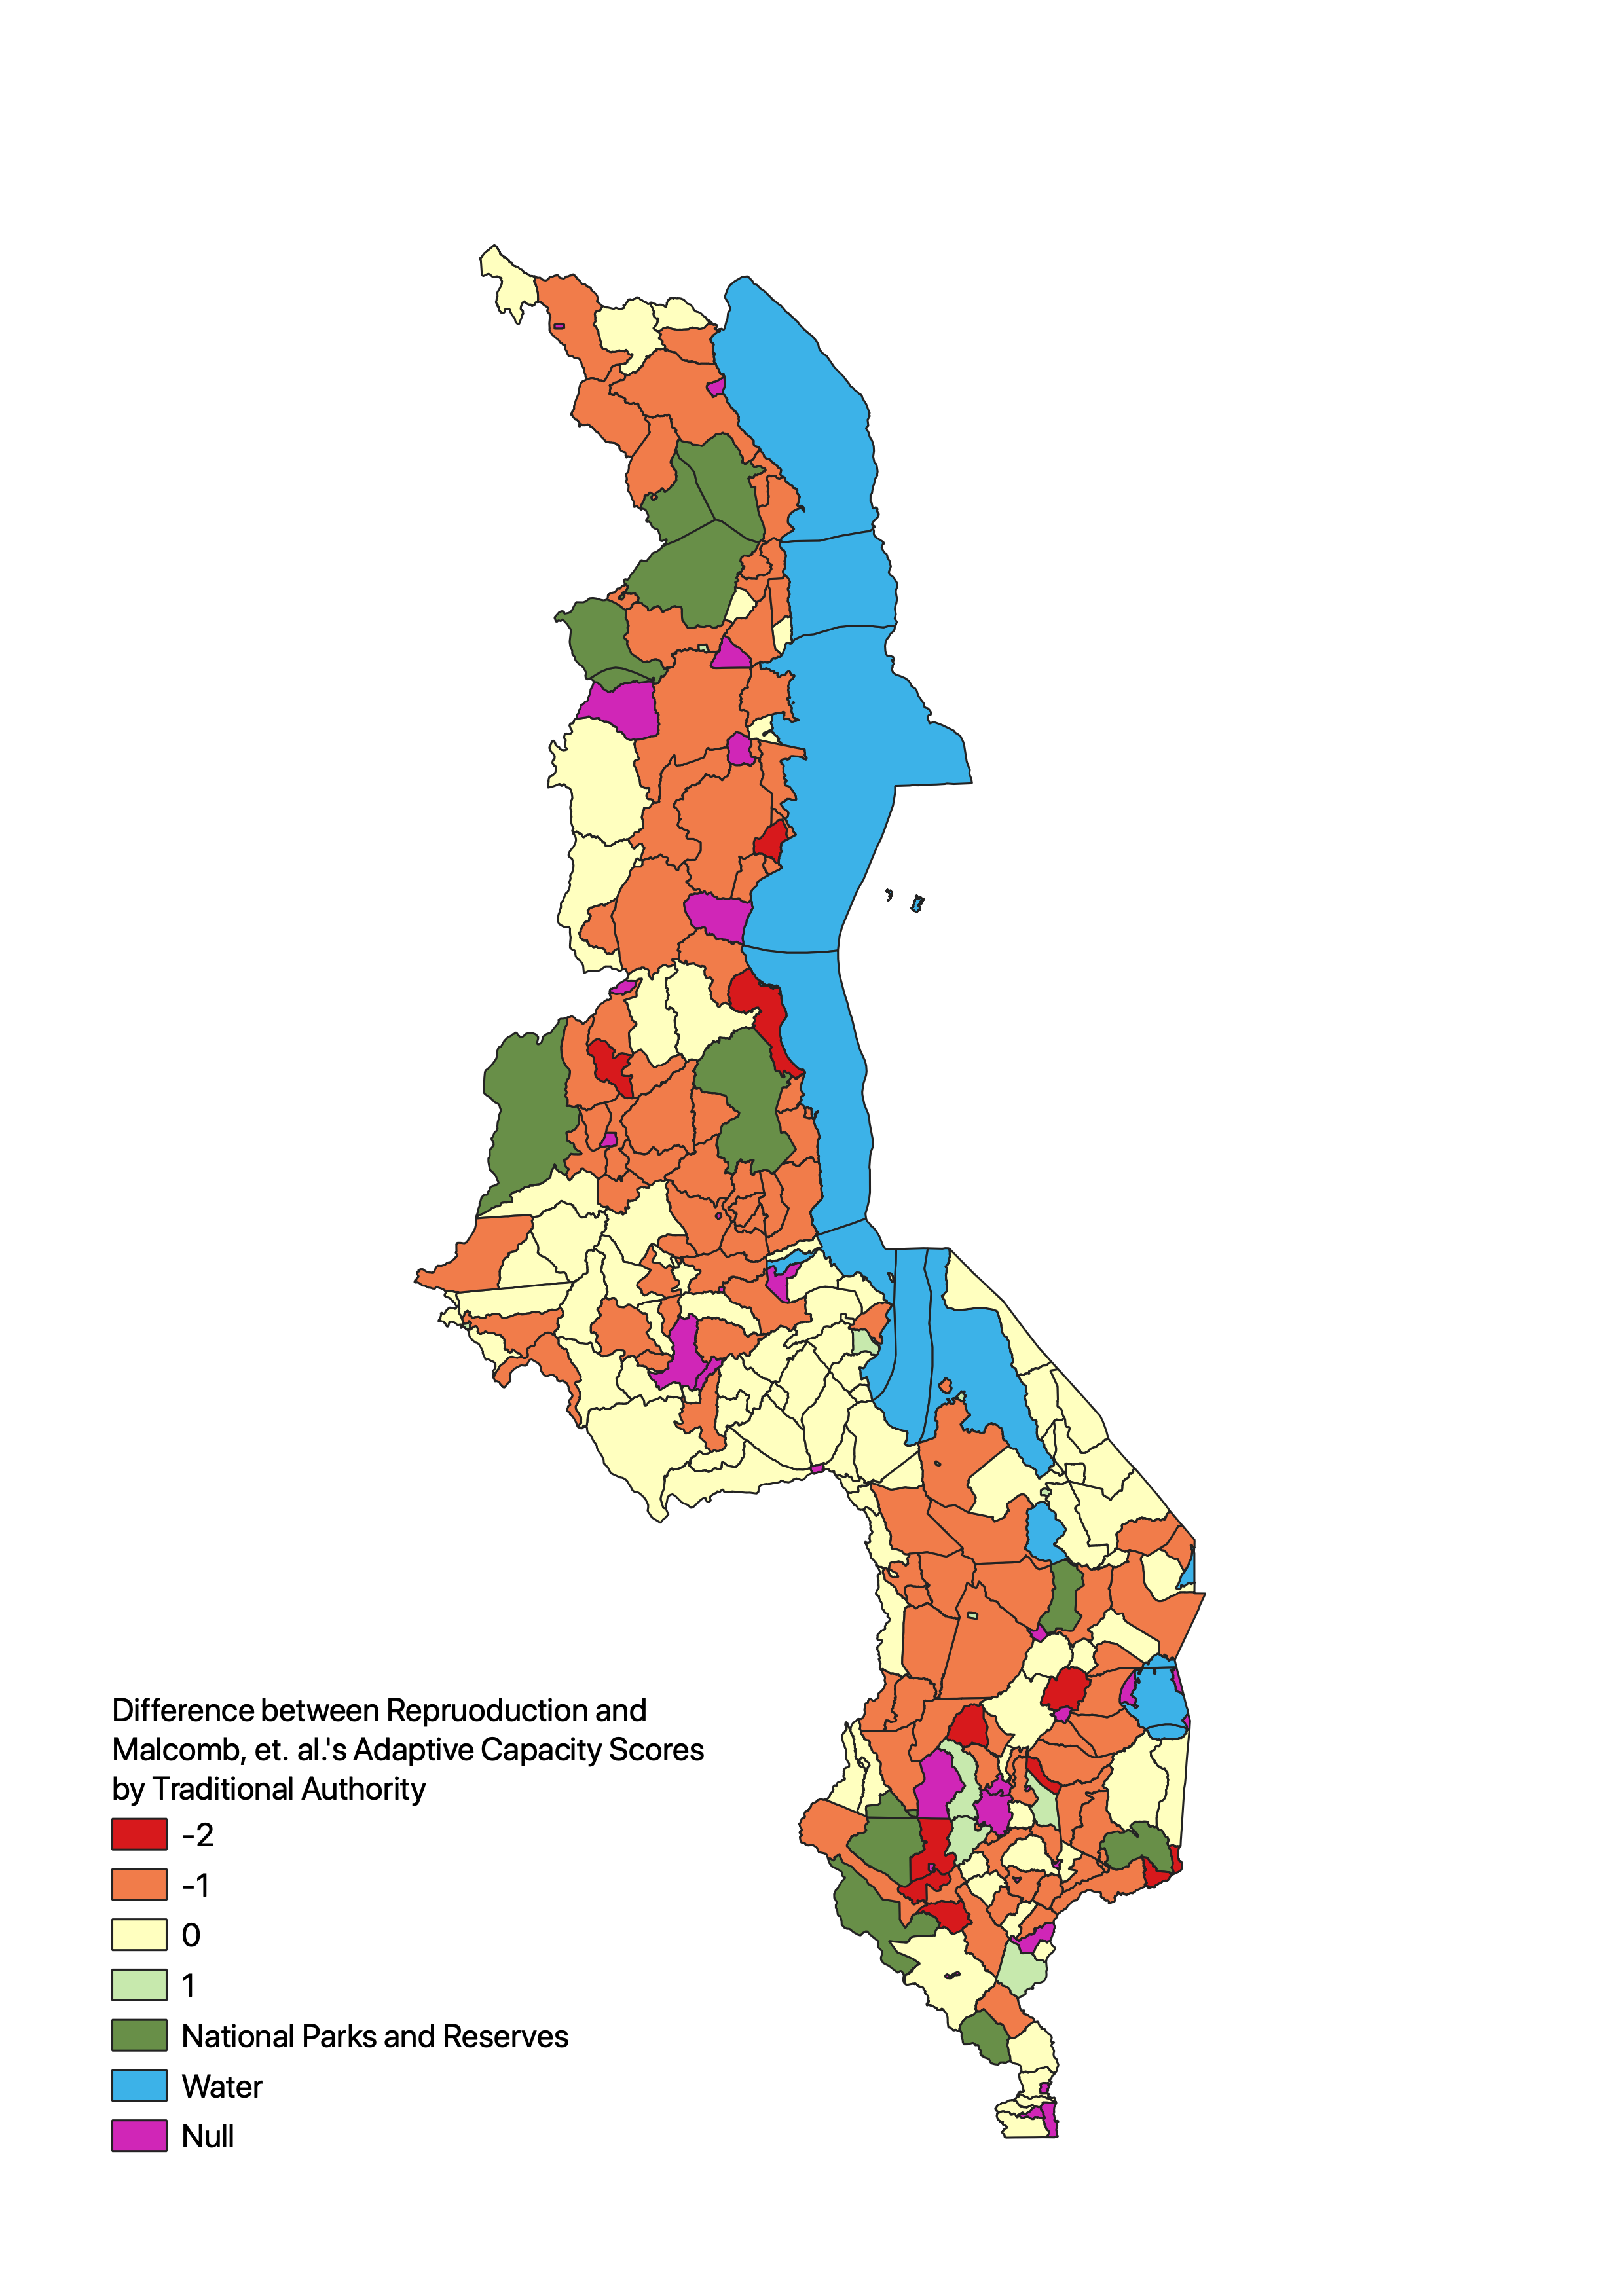
As shown in the above map, while some traditional authorities’ scores - or rather, classes of scores - do hold up, a significant chunk are undercounted by the reproduction analysis, with a whole 108 of 200 traditional authorities with values returned by the reproduction study ending up at least one class, if not two, below the class in the original study, with the remainder split roughly 3:1 returning values of equal class or one class above, respectively.
While very general patterns seem to hold, consistent undercounting on the part of this reproduction implies error on the part of the authors of the original study, or the team that completed this reproduction. In short, the original study was supported in part by the reproduction, but the source of divergence will need to be investigated further.
Resilience
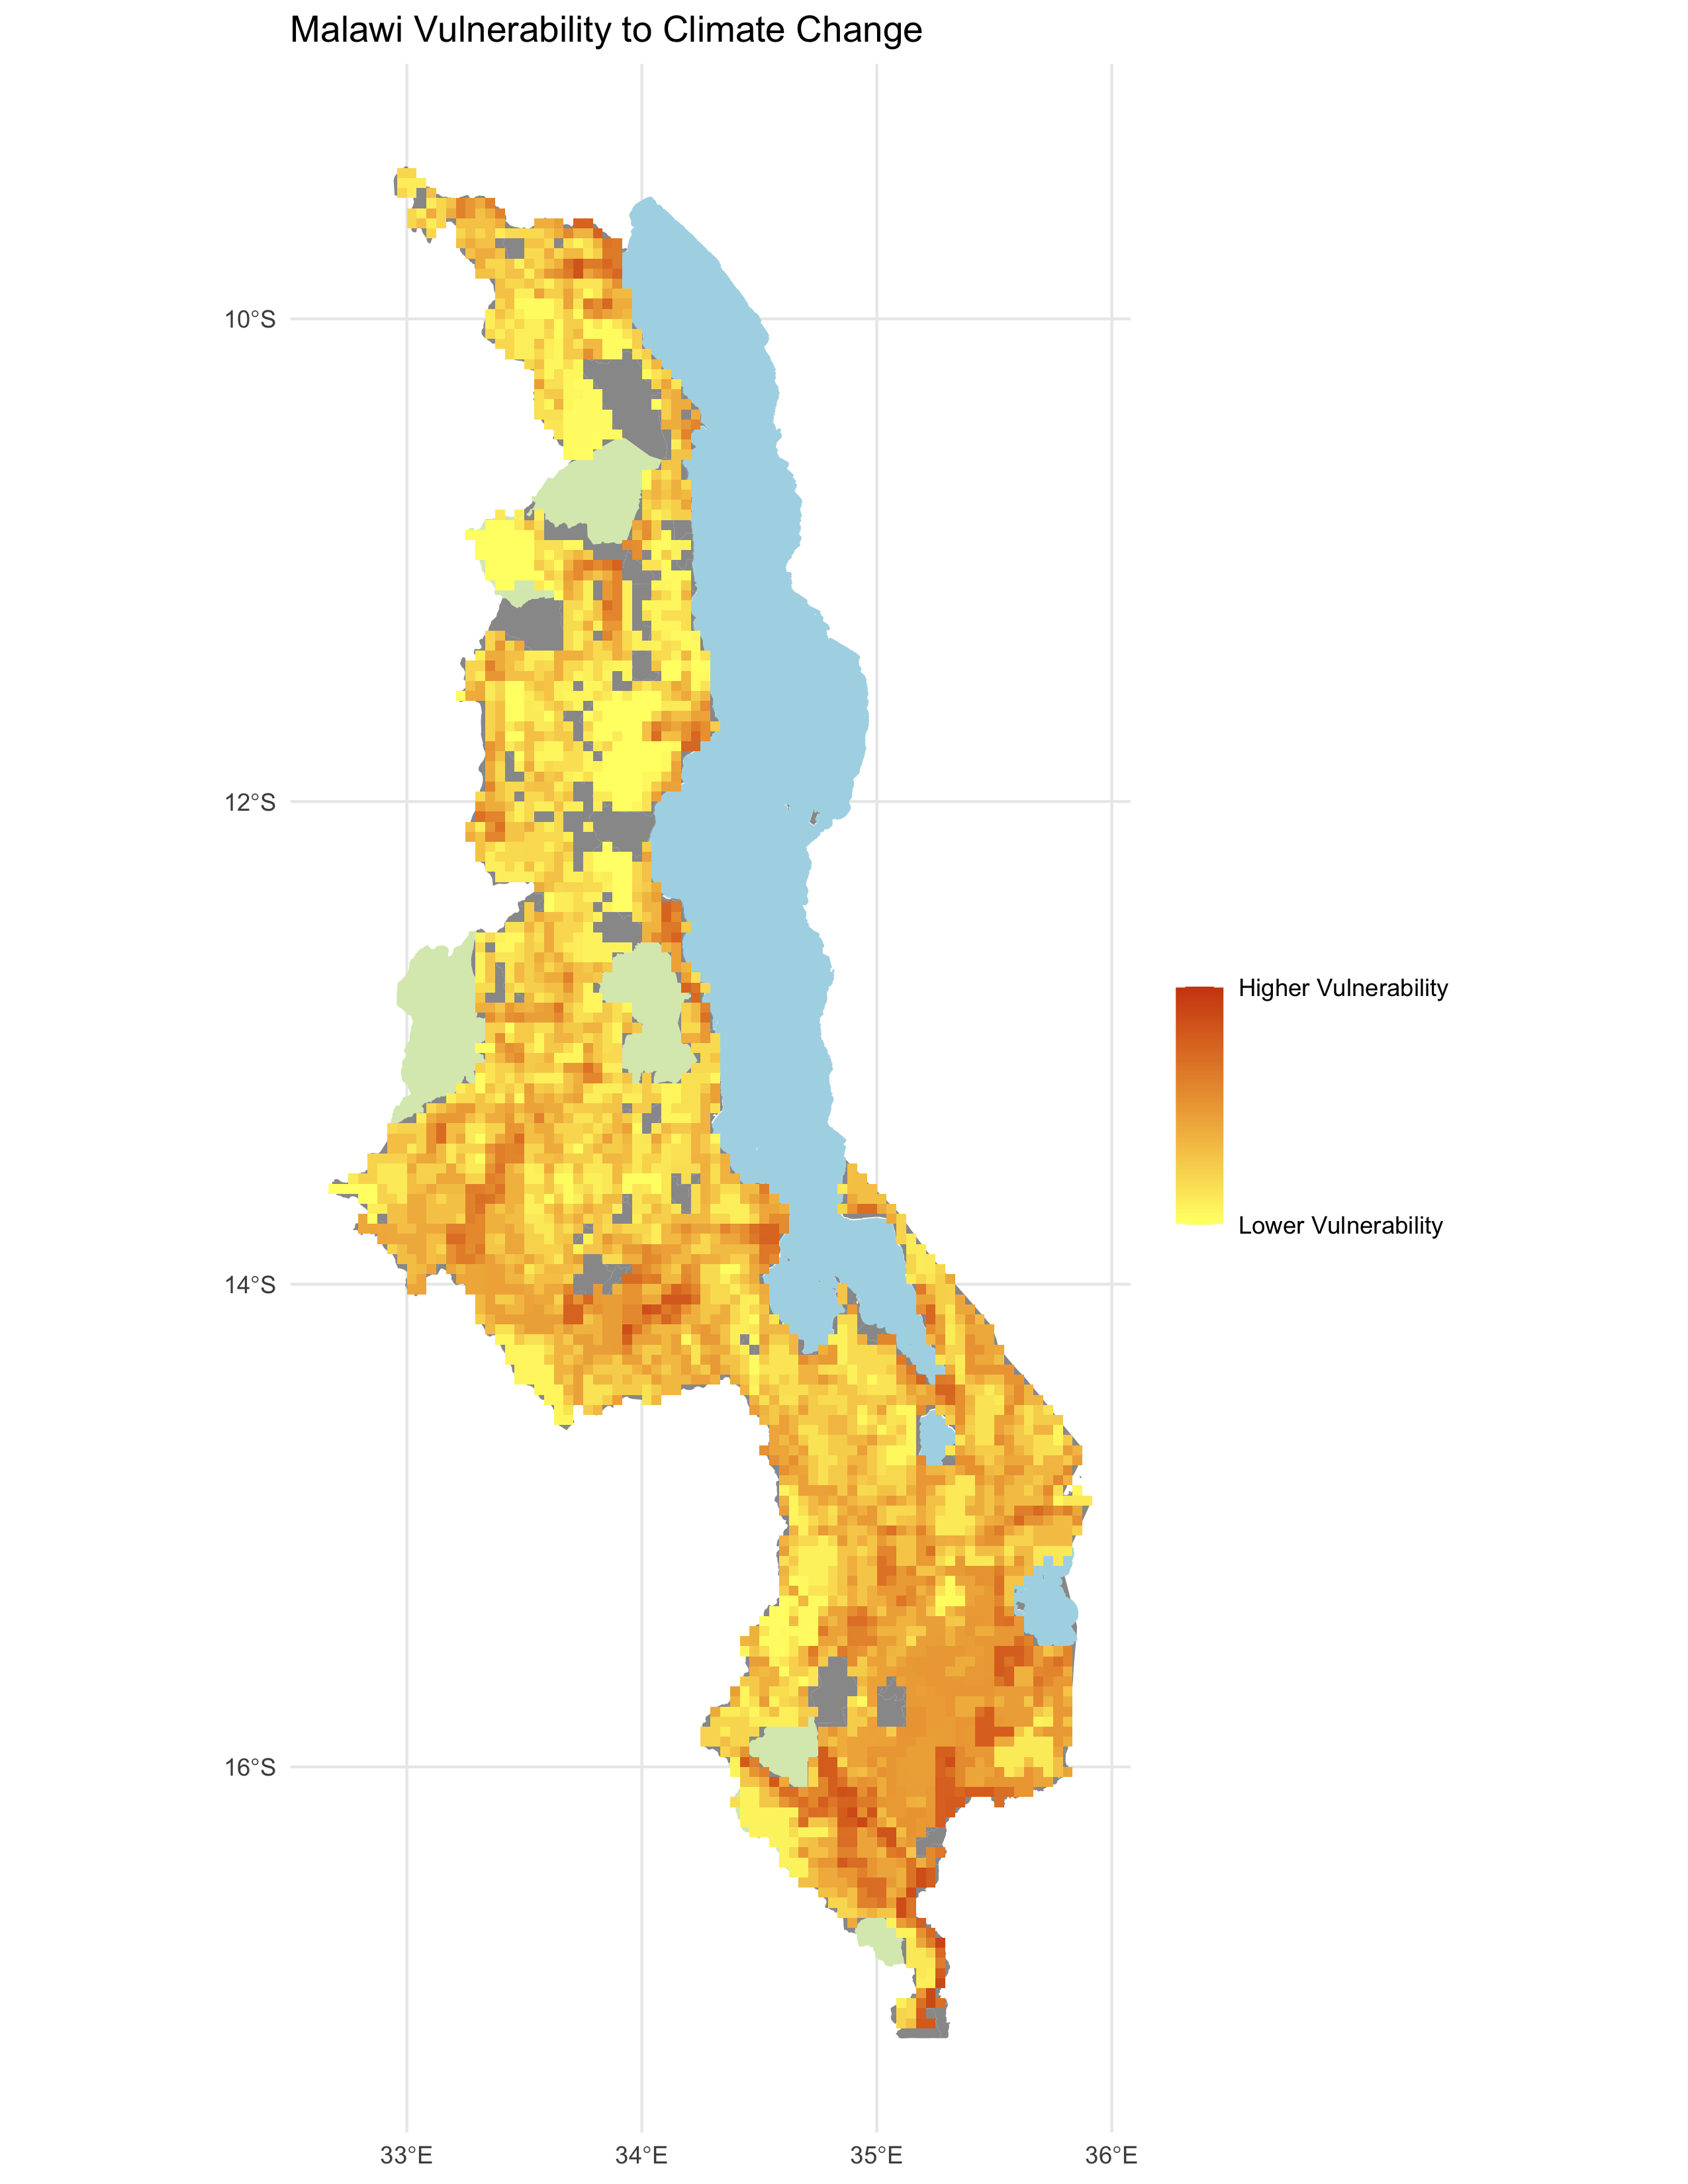
The map displayed above shows vulnerability to climate change in Malawi, as measured using a combination of the DHS “adaptive capacity” data, FEWSNET’s livelihood resilience data, and UNEP’s flood and drought maps. Results are somewhat less clear initially than the results for adaptive capacity, but interestingly, the north seems to generally return “better” values in this analysis as well, and the lakeshore returns “worse” values, with higher vulnerability. Interestingly, the south of the country, through which the Shire River flows, returns values generally in the middle of the range, but low risk of drought near water sources could in some areas balance out higher flood risk. The only areas with high vulnerability occur in small belts, and largely in the far south of the country.
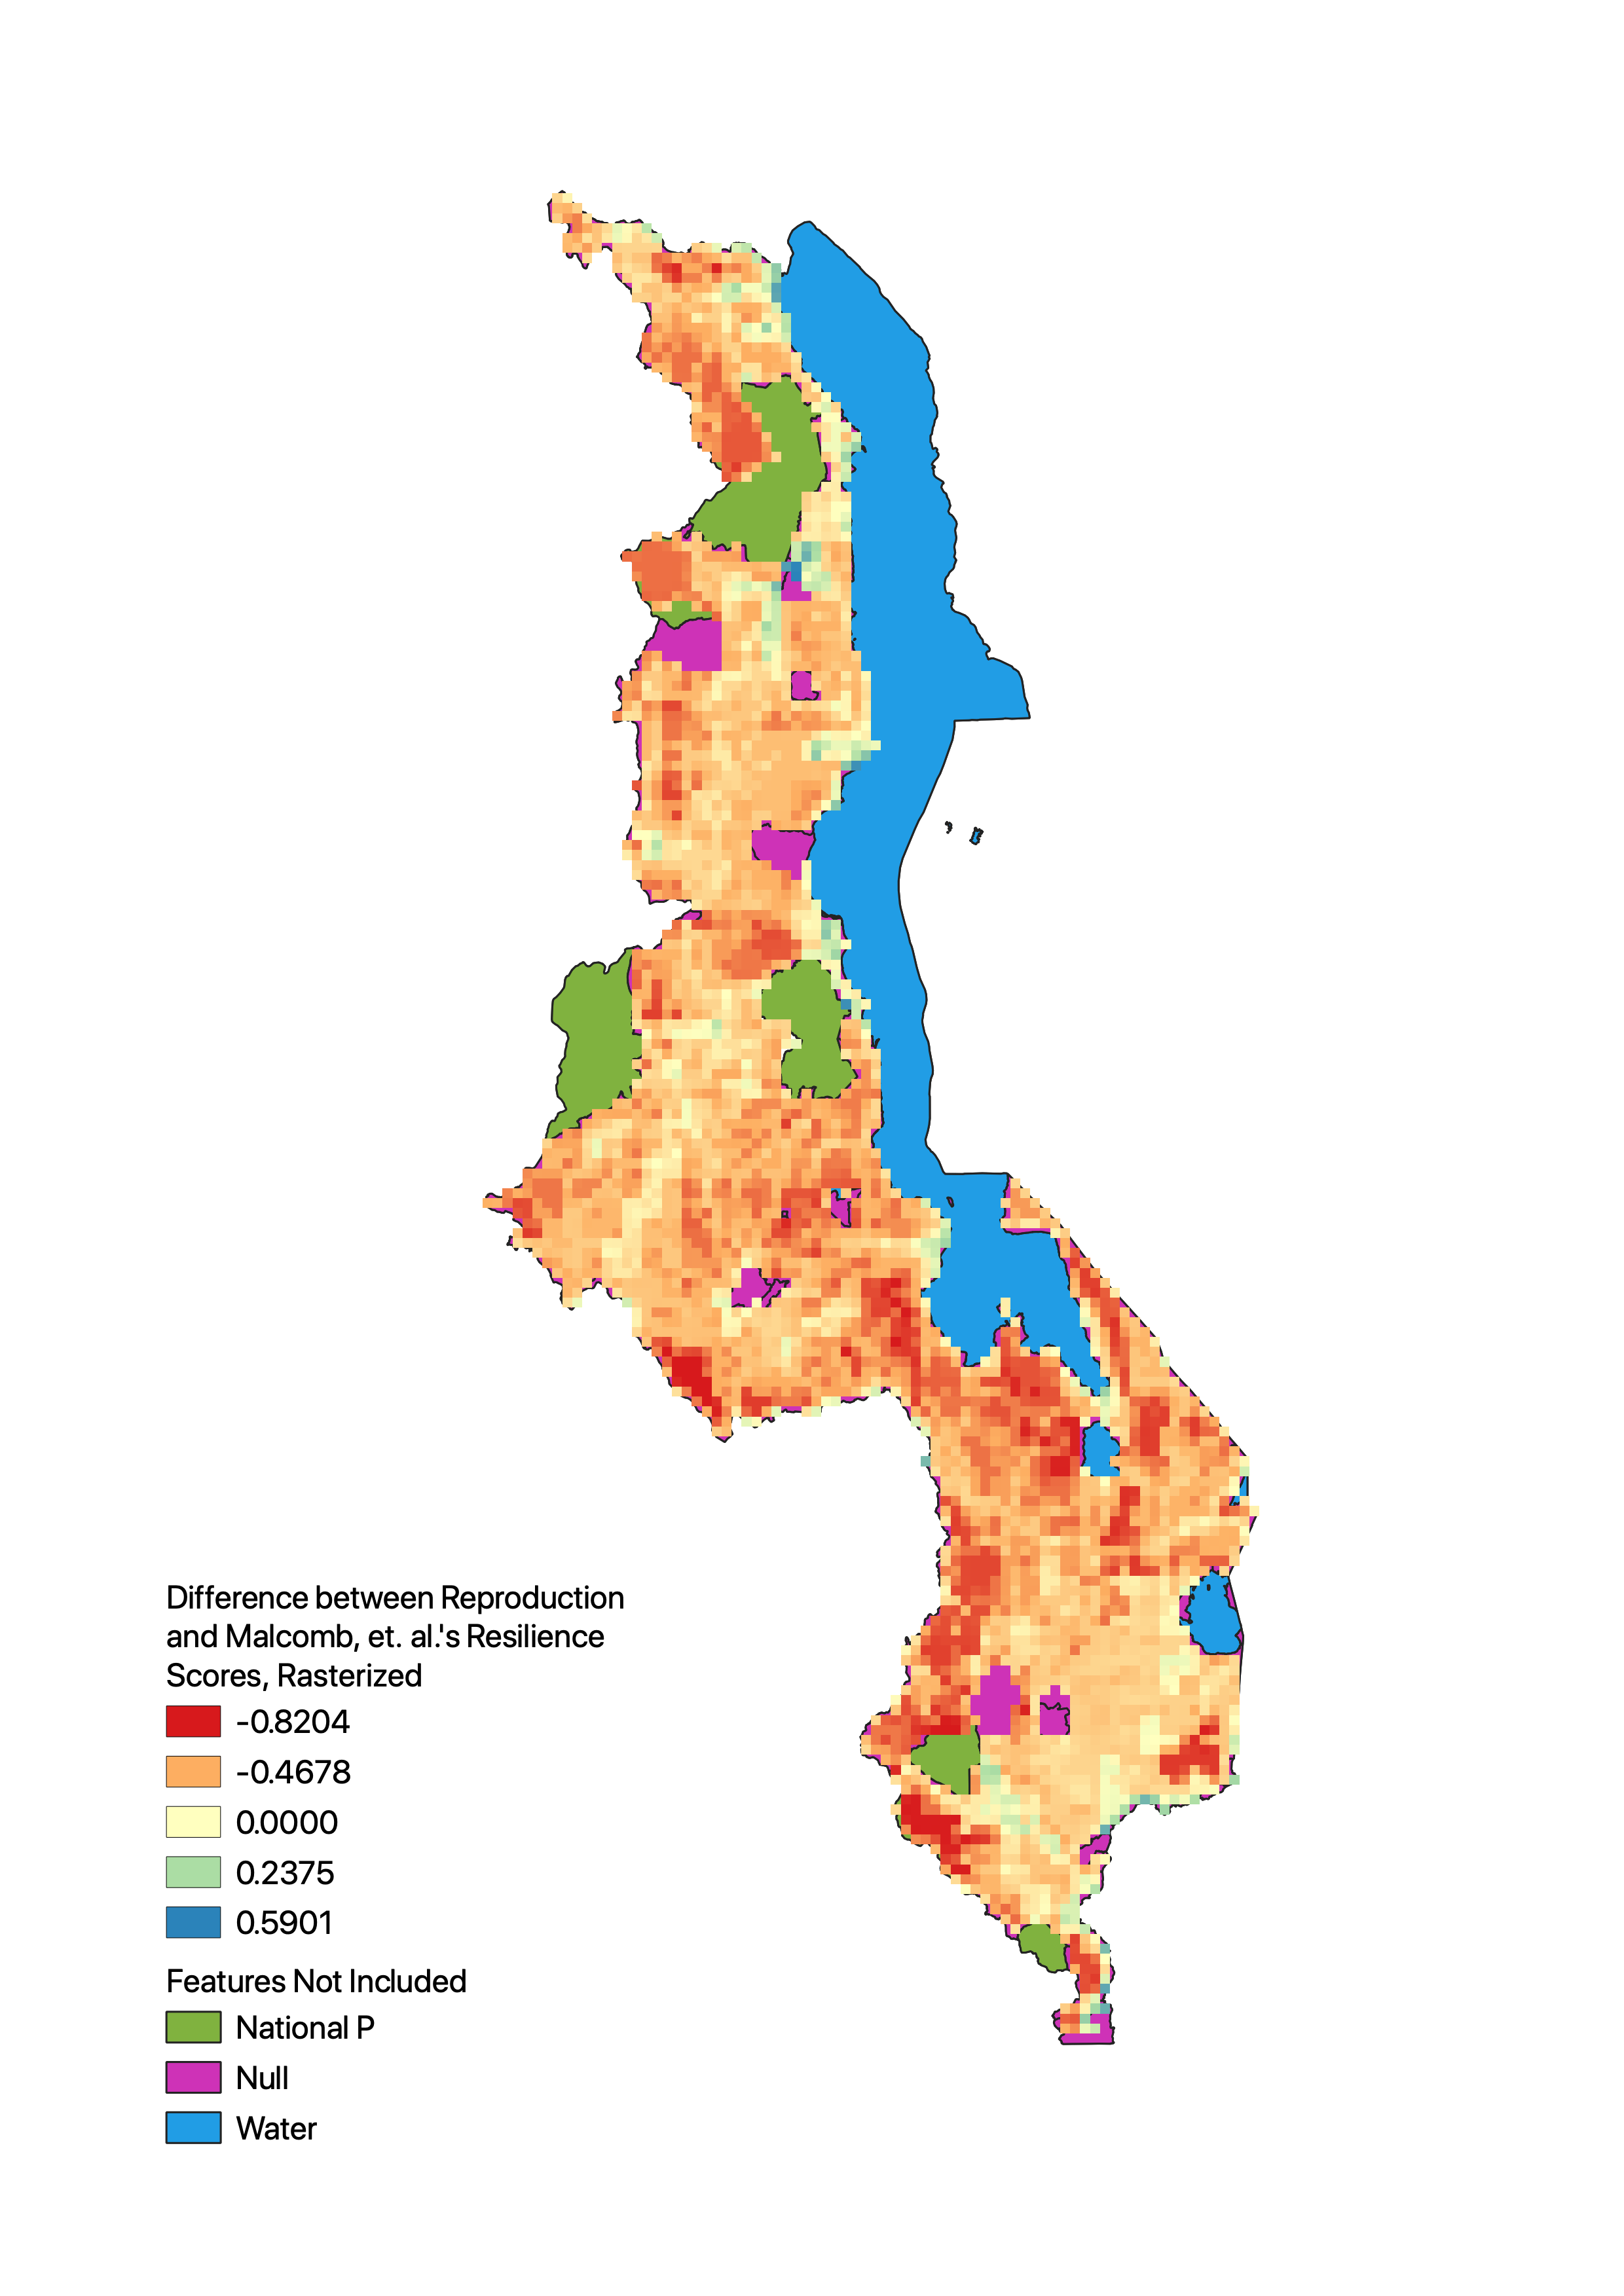
Again, divergences do appear between this analysis and the original study, and again, it seems as if this analysis undercounted resilience, resulting in higher vulnerability in much of the map. The above map shows this graphically, with only some small areas of the map showing 0 or positive values - indicating scores greater than or equal to the original study - and most of the map returning higher orange and red values - indicating scores lower than the original study. Like in the section above, this implies some sort of error, but the specifics will need to be investigated further, and while values might not hold well, general trends do - backed up by consistent divergences in one direction - so the original study is supported in part.
Unplanned Deviations from the Protocol
Unfortunately, due to some lack of clarity in the methods of the original study, some deviations were made between the original interpretation of the workflow for this analysis made in collaboration with Maddie Tango, Steven Montilla, Jackson Mumper, Arielle Landau, and Sanjana Roy and the final workflow created after accessing the code written by Prof. Joseph Holler and Kufre Udoh and the various data used for the project. Three major changes were made between the two iterations of the workflow.
First, based off of the original study - which mentioned scores for each category of data in quintile form and in a range of 0-5 - the group decided to follow the more explicit instructions of the original study and scale the scores in each category to 0-5. AFter accessing the data and code, however, this shifted to a range of 1-5 to align with the quintiles, as a range of 0-5 will produce 6 classes, not fitting with the quintiles described in the study.
Second, the final adaptive capacity score calculated using the DHS data was multiplied by a scale of 20 to make scores appear on a scale more similar to the original study, and thus more easily comparable.
Finally, instead of just scaling scores for livelihood sensitivity from 0-5 as assumed in the original workflow, we had to manually calculate these values based off of a broader set of data. As the figures that contributed to each of the 4 categories in this set of data were not clearly enumerated, the group had to make some subjective assessments of what went into these scores based off of what information was available in the original study. This was particularly apparent and difficult when looking at the “disaster coping strategy,” defined as livelihood coping strategies that contribute to ecological destruction, a fairly vague descriptor for a large list of potential strategies.
Discussion
Broadly, this reproduction was a success, with similar patterns showing up in both this analysis and the original study. Inland northern areas of Malawi had high adaptive capacity and low vulnerability, the shore of Lake Malawi had low adaptive capacity and high vulnerability, and the south of the country had lower adaptive capacity but more varied, moderate vulnerability, perhaps indicating a lower incidence of environmental hazards than in other regions, as prevalence of such hazards and low adaptive capacity would otherwise result in high vulnerability. It should be noted that this analysis’s vulnerability raster seems to be analyzing at a higher resolution with smaller raster pixels, so patterns appear with more fine-grained definition - large dark red swatches in the map produced in the original study could be smaller dark bands surrounded by moderately vulnerable areas in the reproduction’s map.
The fact that in both parts of this analysis, scores were consistently undercounted suggests some sort of significant error in conducting this analysis, either in actually conducting it, or in incorrectly interpreting the original study. For example, the original study, on deeper investigation, seems to imply in some sections - but not in others - that adaptive capacity was first found on a household level, and then aggregated, whereas this analysis aggregated data and then calculated adaptive capacity. As adaptive capacity scores are important on their own and factor into the final vulnerability, such a misinterpretation could affect the entire analysis, and could be a contributing factor to divergences between the two analyses.
With data being largely satisfactory in quality, and code working consistently without error, the onus of divergence and error in these two analyses may be a result of lack of misinterpretation of the original study. As noted in other sections, Malcomb, et. al.’s, study was marred with lack of clarity and significant contradiction in fairly key segments of the methodology and results, and resulting misinterpretations have the potential to completely throw off a reproduction of this model. The choice between 0-5 and quintile scaling should have been clear, whether scores were calculated and then aggregated or whether data was aggregated and then calculated is crucial to know to both interpret and recreate this study, lack of uncertainty surrounding how scores from 1-5 were even calculated leaves far too much room for subjectivity on the part of reproducers of this model, and multiplying adaptive capacity by 20 to even be able to compare results should not be necessary, although admittedly, this error could be an error on the part of those of us who reproduced this study.
Conclusion
In brief, this model found significant lack of capacity for local authorities in much of the country to adapt to climate change and economic and social pressures, and high vulnerability to climate change in equally as large swaths. Important spatial dimensions to both, however - the inland north seems to fair much better than the south, which fares in part better than the lake shore - imply significant regional disparities in adaptive capacity and vulnerability, which can provide authorities to redirect or acquire resources to improve ability to adapt if the model proves to be correct, and could be helpful to identify “problem areas” in other countries if this model is able to be exported. Before this step, however, important uncertainties in how this model was created need to be addressed and clarified, and some attention may need to be given to the subjective way in which some of the variables at play in both analyses were formulated; additional research certainly needs to be conducted on this topic.
References
Include any referenced studies or materials in the AAG Style of author-date referencing.
Report Template References & License
This template was developed by Peter Kedron and Joseph Holler with funding support from HEGS-2049837. This template is an adaptation of the ReScience Article Template Developed by N.P Rougier, released under a GPL version 3 license and available here: https://github.com/ReScience/template. Copyright © Nicolas Rougier and coauthors. It also draws inspiration from the pre-registration protocol of the Open Science Framework and the replication studies of Camerer et al. (2016, 2018). See https://osf.io/pfdyw/ and https://osf.io/bzm54/
Camerer, C. F., A. Dreber, E. Forsell, T.-H. Ho, J. Huber, M. Johannesson, M. Kirchler, J. Almenberg, A. Altmejd, T. Chan, E. Heikensten, F. Holzmeister, T. Imai, S. Isaksson, G. Nave, T. Pfeiffer, M. Razen, and H. Wu. 2016. Evaluating replicability of laboratory experiments in economics. Science 351 (6280):1433–1436. https://www.sciencemag.org/lookup/doi/10.1126/science.aaf0918.
Camerer, C. F., A. Dreber, F. Holzmeister, T.-H. Ho, J. Huber, M. Johannesson, M. Kirchler, G. Nave, B. A. Nosek, T. Pfeiffer, A. Altmejd, N. Buttrick, T. Chan, Y. Chen, E. Forsell, A. Gampa, E. Heikensten, L. Hummer, T. Imai, S. Isaksson, D. Manfredi, J. Rose, E.-J. Wagenmakers, and H. Wu. 2018. Evaluating the replicability of social science experiments in Nature and Science between 2010 and 2015. Nature Human Behaviour 2 (9):637–644. http://www.nature.com/articles/s41562-018-0399-z.
 This work is licensed under a Creative Commons Attribution-NonCommercial-ShareAlike 4.0 International License.